Tesla Earnings Due Wednesday

Tesla is set to report Q1 2026 results after market close on Wednesday, April 22. Consensus expectations point to revenue of approximately $21.9 billion, up around 13% year over year, and adjusted EPS of $0.36, reflecting growth of roughly 33%. This compares with Q1 2025 revenue of $19.34 billion and EPS of $0.27. However, this would mark a sequential decline from Q4 2025, when adjusted EPS reached $0.50 and gross margins expanded to 20.1%, the highest level in two years.
Beyond headline figures, focus will be on automotive gross margins (consensus ~16%) and the credibility of the Robotaxi timeline, alongside continued growth in Full Self-Driving subscriptions, which recently increased 38% to 1.1 million users. The energy segment remains a key strength, with Q4 2025 revenue at $3.84 billion, up 25% year over year, supported by record deployments of 14.2 GWh.
Diversification beyond automotive continues to support Tesla’s long-term positioning. The energy storage business is scaling, while autonomy and AI-related initiatives—including FSD, Cybercab, and the Optimus robot—reinforce the company’s broader technology narrative.
On the downside, full-year 2025 revenue declined approximately 3% to $94.8 billion, while vehicle deliveries fell for a second consecutive year. At the same time, intensifying competition in the EV space—particularly from Chinese manufacturers—combined with elevated CapEx requirements (around $20 billion planned for 2026), is increasing pressure on cash flow.
Recent developments have also raised questions around demand dynamics. Of the 7,071 Cybertrucks reportedly sold in Q4 2025, approximately 20% were purchased by entities affiliated with Elon Musk, including SpaceX. Excluding these purchases, reported sales would have declined significantly.
The options market is currently pricing an implied move of approximately 5% following the earnings release.
TECHNICAL ANALYSIS
TSLA continues to exhibit volatile and irregular price action, characterised by multiple gaps, false breakouts, and wide intraday ranges.
A key resistance zone remains around $485, which formed a double top in November. From that level, price retraced to $333, a critical support area that has held since late 2024. The stock recently closed at $400.15, with an intraday high of $408.98.
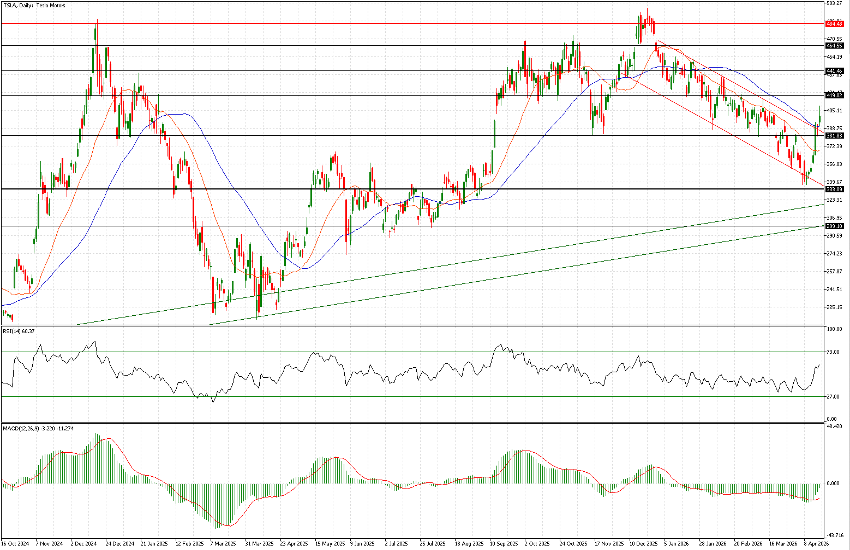
While the descending channel in place since the start of the year has been broken, confirmation remains uncertain given the frequency of false breakouts. Nonetheless, momentum indicators are currently showing constructive signals.
On the upside, resistance levels are located at $419 and $440. On the downside, a move below $380 would suggest renewed bearish pressure, exposing $356 and potentially a retest of $333.
Based on the options market’s implied move of approximately 5%, post-earnings price action could align closely with the $380 support and $420 resistance levels.